Search

Indy Ref: How Scotland Voted

Share
By Joshua Townsley

Following an eighteen month-long campaign, Scotland finally voted to reject independence by a margin of 55% to 45%. This unprecedented vote captured and dominated the national debate, inspiring a record 84.59% turnout. Joshua Townsley breaks down and highlights the key voting trends based on the fascinating insight into how the 3,619,915 voters cast their ballots on the 18th September provided by Lord Ashcroft’s polling.

Full results: http://www.bbc.co.uk/news/events/scotland-decides/results

Ashcroft Poll conducted: 18th & 19th September, sample size: 2,047 adults (831 online, 1,216 telephone) Full tables can be found at http://lordashcroftpolls.com/2014/09/scotland-voted/. Caveats apply for polling data, including small sample size for certain groups (most notably for this poll, only 14 under-18s in sample).


Regional Breakdown


As is pointed out over on 'Election Data' (http://election-data.blogspot.co.uk/2014/09/what- scottish-independence-referendum.html), the lack of data restricts the geographical analysis that is possible, as voting data is limited to council areas. Only 4 local authorities returned a majority of Yes votes. These were the heavily urbanised Glasgow City, North Lanarkshire, West Dumbartonshire, and Dundee City. The strongest No vote resided in the Orkney and Shetland Islands, the Scottish borders, and Dumfries and Galloway. While Dundee and Glasgow voted Yes, Edinburgh and Aberdeen registered strong No votes (see below).


Local Authority                        
                   %Yes 
               %No
Orkney Islands
32.8
67.2
Scottish Borders
33.44
66.56
Dumfries & Galloway
34.33
65.67
Shetland Islands
36.29
63.71
East Renfrewshire
36.81
63.19
East Lothian
38.28
61.72
East Dunbartonshire
38.8
61.2
Edinburgh
38.9
61.1
Aberdeenshire
39.64
60.36
Perth & Kinross
39.81
60.19
Stirling
40.23
59.77
Aberdeen City
41.39
58.61
Argyll & Bute
41.28
58.72
South Ayrshire
42.13
57.87
Moray
42.44
57.56
Angus
43.68
56.32
Midlothian
43.7
56.3
West Lothian
44.82
55.18
Fife
44.95
55.05
South Lanarkshire
45.33
54.67
Clackmannanshire
46.2
53.8
Falkirk
46.53
53.47
Comhairle nan Eilean Siar
46.58
53.42
Highland
47.08
52.92
Renfrewshire
47.19
52.81
East Ayrshire
47.22
52.78
North Ayrshire
48.99
51.01
Inverclyde
49.92
50.08
North Lanarkshire
51.07
48.93
Glasgow
53.49
46.51
West Dunbartonshire
53.96
46.04
Dundee City
57.35
42.65

Demographic Breakdown


As was widely reported during the campaign, the Yes camp struggled to make the case for independence to Women as easily as to Men. In the end, the gender gap was just 3%, with 47% of men voting Yes compared to 44% of women. While the gender gap existed, it was perhaps not as significant as expected.

A starker generation gap emerged from the referendum, however. All age groups under 55 voted Yes, while age groups over 55 voted overwhelmingly No. Salmond’s decision to allow 16 and 17 year olds the vote appeared to be a wise one ultimately as support for independence was strongest among the newly franchised teenagers, 71% of who voted Yes. (NB: given the small sample size of just 14 under-18s in the poll, conclusions regarding this data must be taken with a large pinch of salt).


In terms of class, perhaps best ascertained by socio-economic groupings, support for independence was highest among C2 (52%), and weakest among AB (40%). This appears to confirm the narrative that poorer, less financially secure voters would support independence in the hope of bringing about radical change to their financial situation. Interestingly however, the lowest socio-economic group, DE voted No 55/45, which makes this assumption less clear.

Party Preferences


Unsurprisingly, 95% of the Conservative and Unionist Party’s 2010 General Election voters opted for a No vote, and 86% of SNP voters voted Yes. The 14% of 2010 SNP voters that opposed independence raises questions concerning the basis of the SNP’s support, which does not always seem to be based on support for independence per se. Interestingly, while the conventional wisdom held that Labour voters abandoned their ‘traditional’ party loyalties in favour of independence (indeed, 37% of 2010 Labour voters did so), a higher percentage (39%) of Lib Dem 2010 voters cast their ballots for independence. These appear to be largely former Lib Dem voters that have since abandoned the party in Scotland, with the remaining Lib Dem voters in the 2012 Holyrood elections breaking more significantly for the No camp, 77/23.


Yes Scotland v Better Together


In terms of the impact both the Yes Scotland and Better Together campaigns made, a useful guide might be how voters who made their mind up since the beginning of the year voted. Among this cohort, 55% voted Yes, and 45% voted No. Among voters who made their decision in the last month of the campaign, 59% voted for independence. 52% of Yes voters made their mind up since the beginning of the year, compared to just 28% of No voters. 62% of No voters ‘always knew how they would vote’, while 39% of Yes voters made their decision during the last month. Ultimately, this seems to indicate that the Yes Scotland campaign did a better job of persuading late undecided voters, while the Better Together campaign began the campaign with a solid lead among voters who always knew how they would vote (66%).
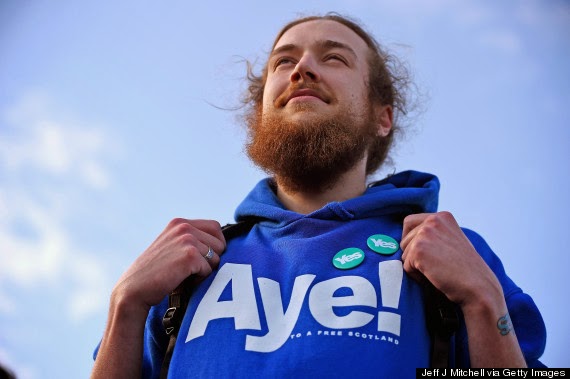
Source: http://i.huffpost.com/gen/2010596/thumbs/o-YES-SCOTLAND-570.jpg
The issue of ‘shy unionists’, or what Alistair Darling called the ‘silent majority’ represented the No campaign’s narrative in the final week of the campaign. This described the belief that Yes supporters were more vocal in their support for independence, while ‘shy unionists’, who were in the majority, kept relatively quiet about their voting preference. Ashcroft’s polling indicates that while just 11% of Yes voters were ‘reluctant to tell friends, family or colleagues’ how they voted, 14% of No voters felt the same way. This difference of just 3% in the level of reluctance between the two sets of supporters to discuss their preference may provide an indication of the ‘shy unionist’ phenomenon, but does not appear conclusive.

The Issues


The difference in the top issues between Yes and No voters is stark, and largely predictable based on the campaigns’ competing messages. Among Yes voters, the top issues in determining their decision were disaffection with Westminster politics (74%), the NHS (54%), and tax and public spending (33%). Among No voters, the top issues were the pound (57%), pensions (37%), and the NHS (36%). This also is in line with the demographic makeup of both sets of supporters, with older voters that are more likely to be concerned by pensions and currency, voting No.

70% of Yes voters cited a belief that ‘all decisions about Scotland should be taken in Scotland’ as their most important reason for voting Yes, only 20% cited ‘Scotland’s future looked brighter under independence’, and just 10% cited ‘no more Conservative governments’. Meanwhile, the most important reason for No voters unsurprisingly involved the risk and uncertainty of independence, with just under half (47%) of No voters citing currency, job, EU, prices and economic risks as the main reason for their vote. Somewhat depressingly for unionists, just 27% of No voters cited ‘strong attachment to the UK’s history, culture, and traditions’ as the main reason for their decision, and just 25% cited extra powers for the Scottish Parliament.


‘Neverendum’?


Just days before the day of the referendum, Alex Salmond confirmed that the decision would be final for ‘a generation’. The extent to which the result of the referendum settles the issue of Scottish independence remains to be seen. But Ashcroft’s poll provides some interesting insight into the mindsets of the two sets of supporters. 45% of Yes voters think the issue of independence will remain settled for just five years, compared to 20% of No voters. Only 12% of Yes voters, and 25% of No voters think the issue is now settled forever. This seems to indicate a belief that the issue is not fully settled, and that the referendum will certainly not represent a ‘once in a lifetime’ decision. The prospect of the ‘Neverendum’ will be heavily affected by the ability of the main Westminster parties to agree and implement the promised ‘Devo Max’ package of changes to the satisfaction of the majority of Scottish voters. Failure to do so will result in a further increase in anti-Westminster sentiment in Scotland, and raise the prospect of another referendum in the future. Over to you, Messrs Cameron, Miliband and Clegg.

Source: http://i.telegraph.co.uk/multimedia/archive/02103/scotland-flag-1_2103925b.jpg


Joshua Townsley is a PhD researcher at the University of Kent, specialising in political campaigning and electoral politics. For more information, see here: https://www.kent.ac.uk/politics/staff/assistant-lecturers/townsley.html

Share
 
Copyright © 2015 The Ballot Box
Template By Herdiansyah Hamzah | Design By Jabin Law