After months of campaigning by both the Yes and No campaigns alongside a night of unfolding drama, Scotland voted “No” to Independence at 06:08 am.
 |
| Source: http://d18lkz4dllo6v2.cloudfront.net/cumulus_uploads/entry/10489/miean.png?w=300 |
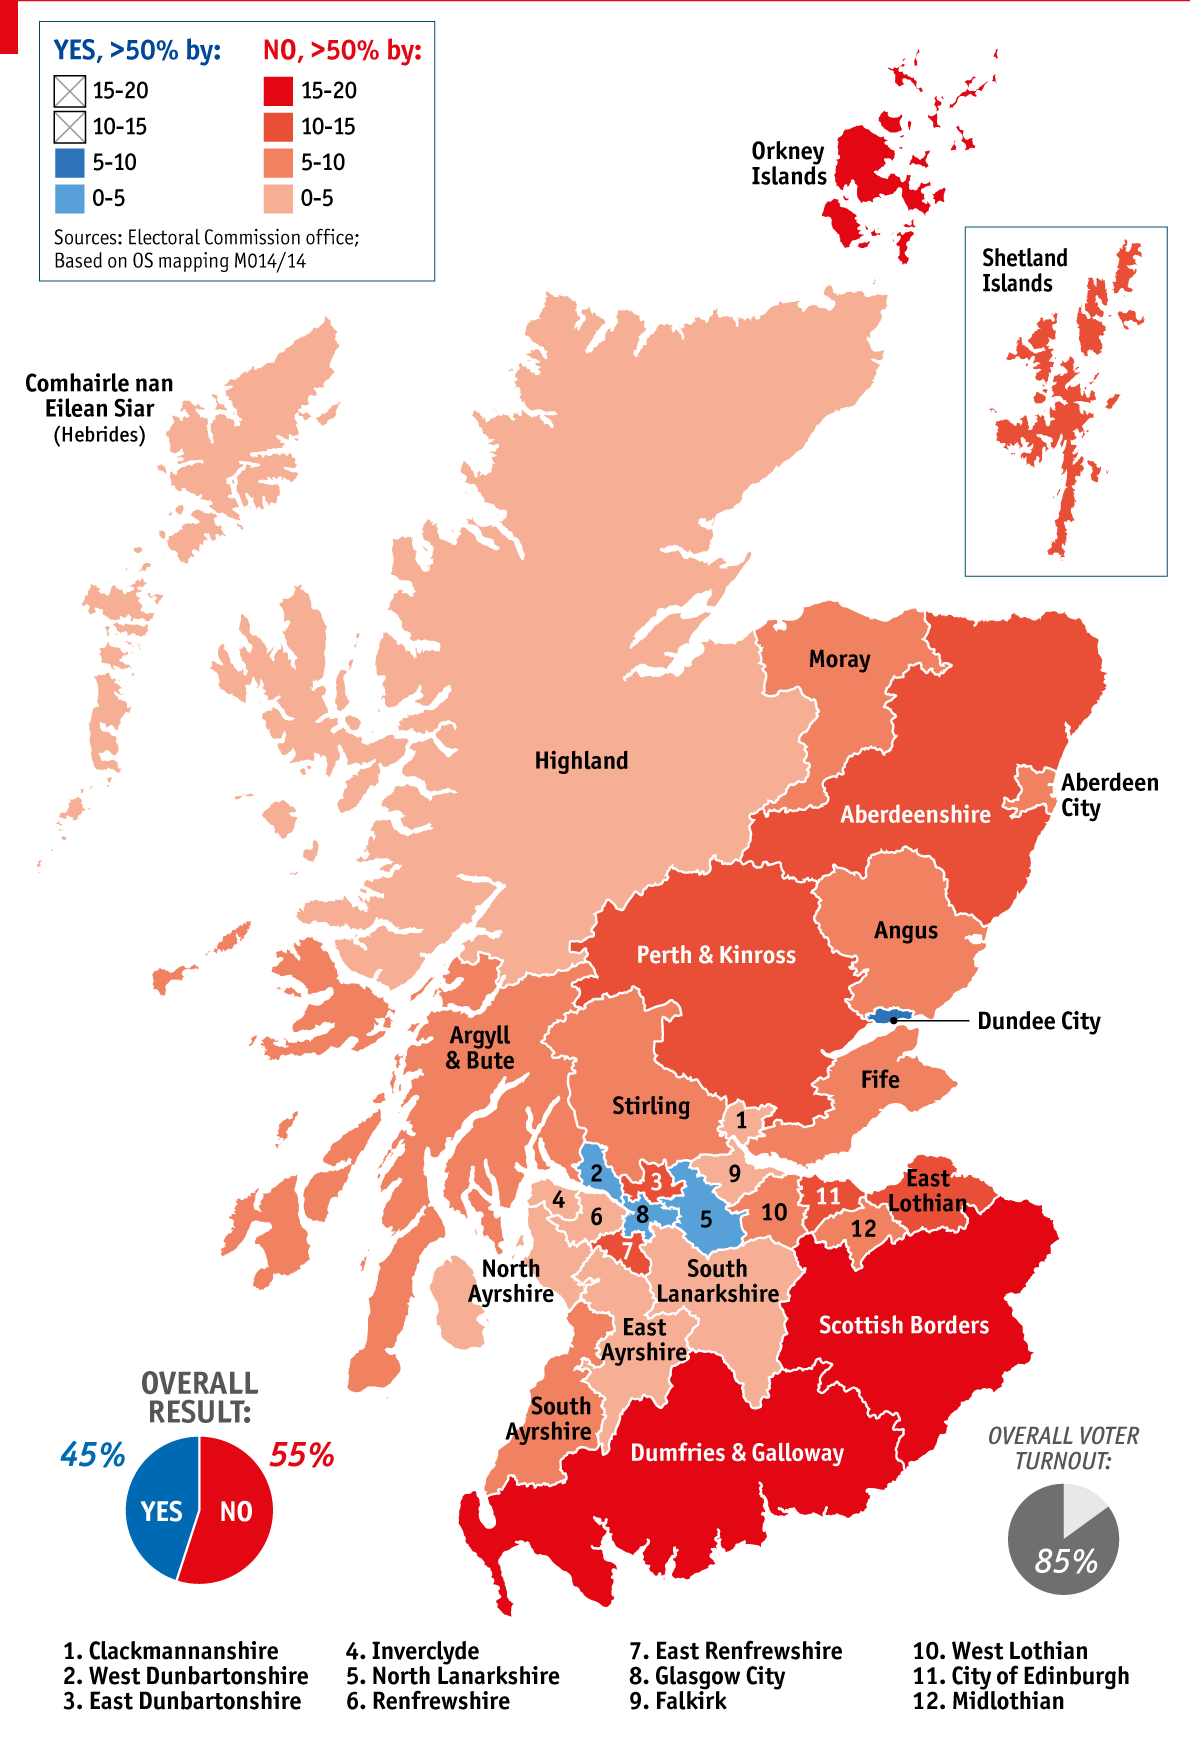
The Breakdown
According to the Political Scientist Prof. John Curtice from Strathclyde University:
·
55% voted “No” and 45% “Yes.”
· “No” won by 2,0001, 926 to 1,617,989 “Yes”
·
Turnout around 84.5%
·
3,429 rejected papers
The Yes Vote
The local
authorities with the highest proportion of “Yes”
votes were:
Dundee: 57%
West
Dunbartonshire: 54%
Glasgow: 53%
North
Lanarkshire: 51%
The other
local authorities said “No.”
 |
| Source: http://cdn.static-economist.com/sites/default/files/imagecache/original-size/images/2014/09/blogs/blighty/20140920_brm914_4.png |
Key Stats: Demographics of the “No Vote”
The No vote was higher in places with:- Middle-class population
- Older generation (65+)
- Rural Scotland
- High Migrant Population
How “Better Together” won the Referendum
In sum, the “No” win can be
attributed to the following:
1. Identity & Attitudes: That Scottish
feel British
2. Economics: Risk Factor
3. Psychology: Perceptions of Fear towards
Independence


